I’ve shown that Elmer accurately calculates a cantilevered beam’s lowest natural frequency, but I wanted to test Elmer on a real part. So I bought a tuning fork off amazon.com and compared the Elmer analytical frequencies to the real life free-free frequencies. Elmer was accurate to within 3%.
Methodology:
- Get tuning fork from the internet
- Model tuning fork in FreeCAD
- Mesh in Gmsh
- Import mesh into Elmer (Finite Element Analysis (FEA) software), solve for frequencies in Elmer
- Ping test the part in real life to find the actual frequencies
- Compare the calculated to actual results
Materials:
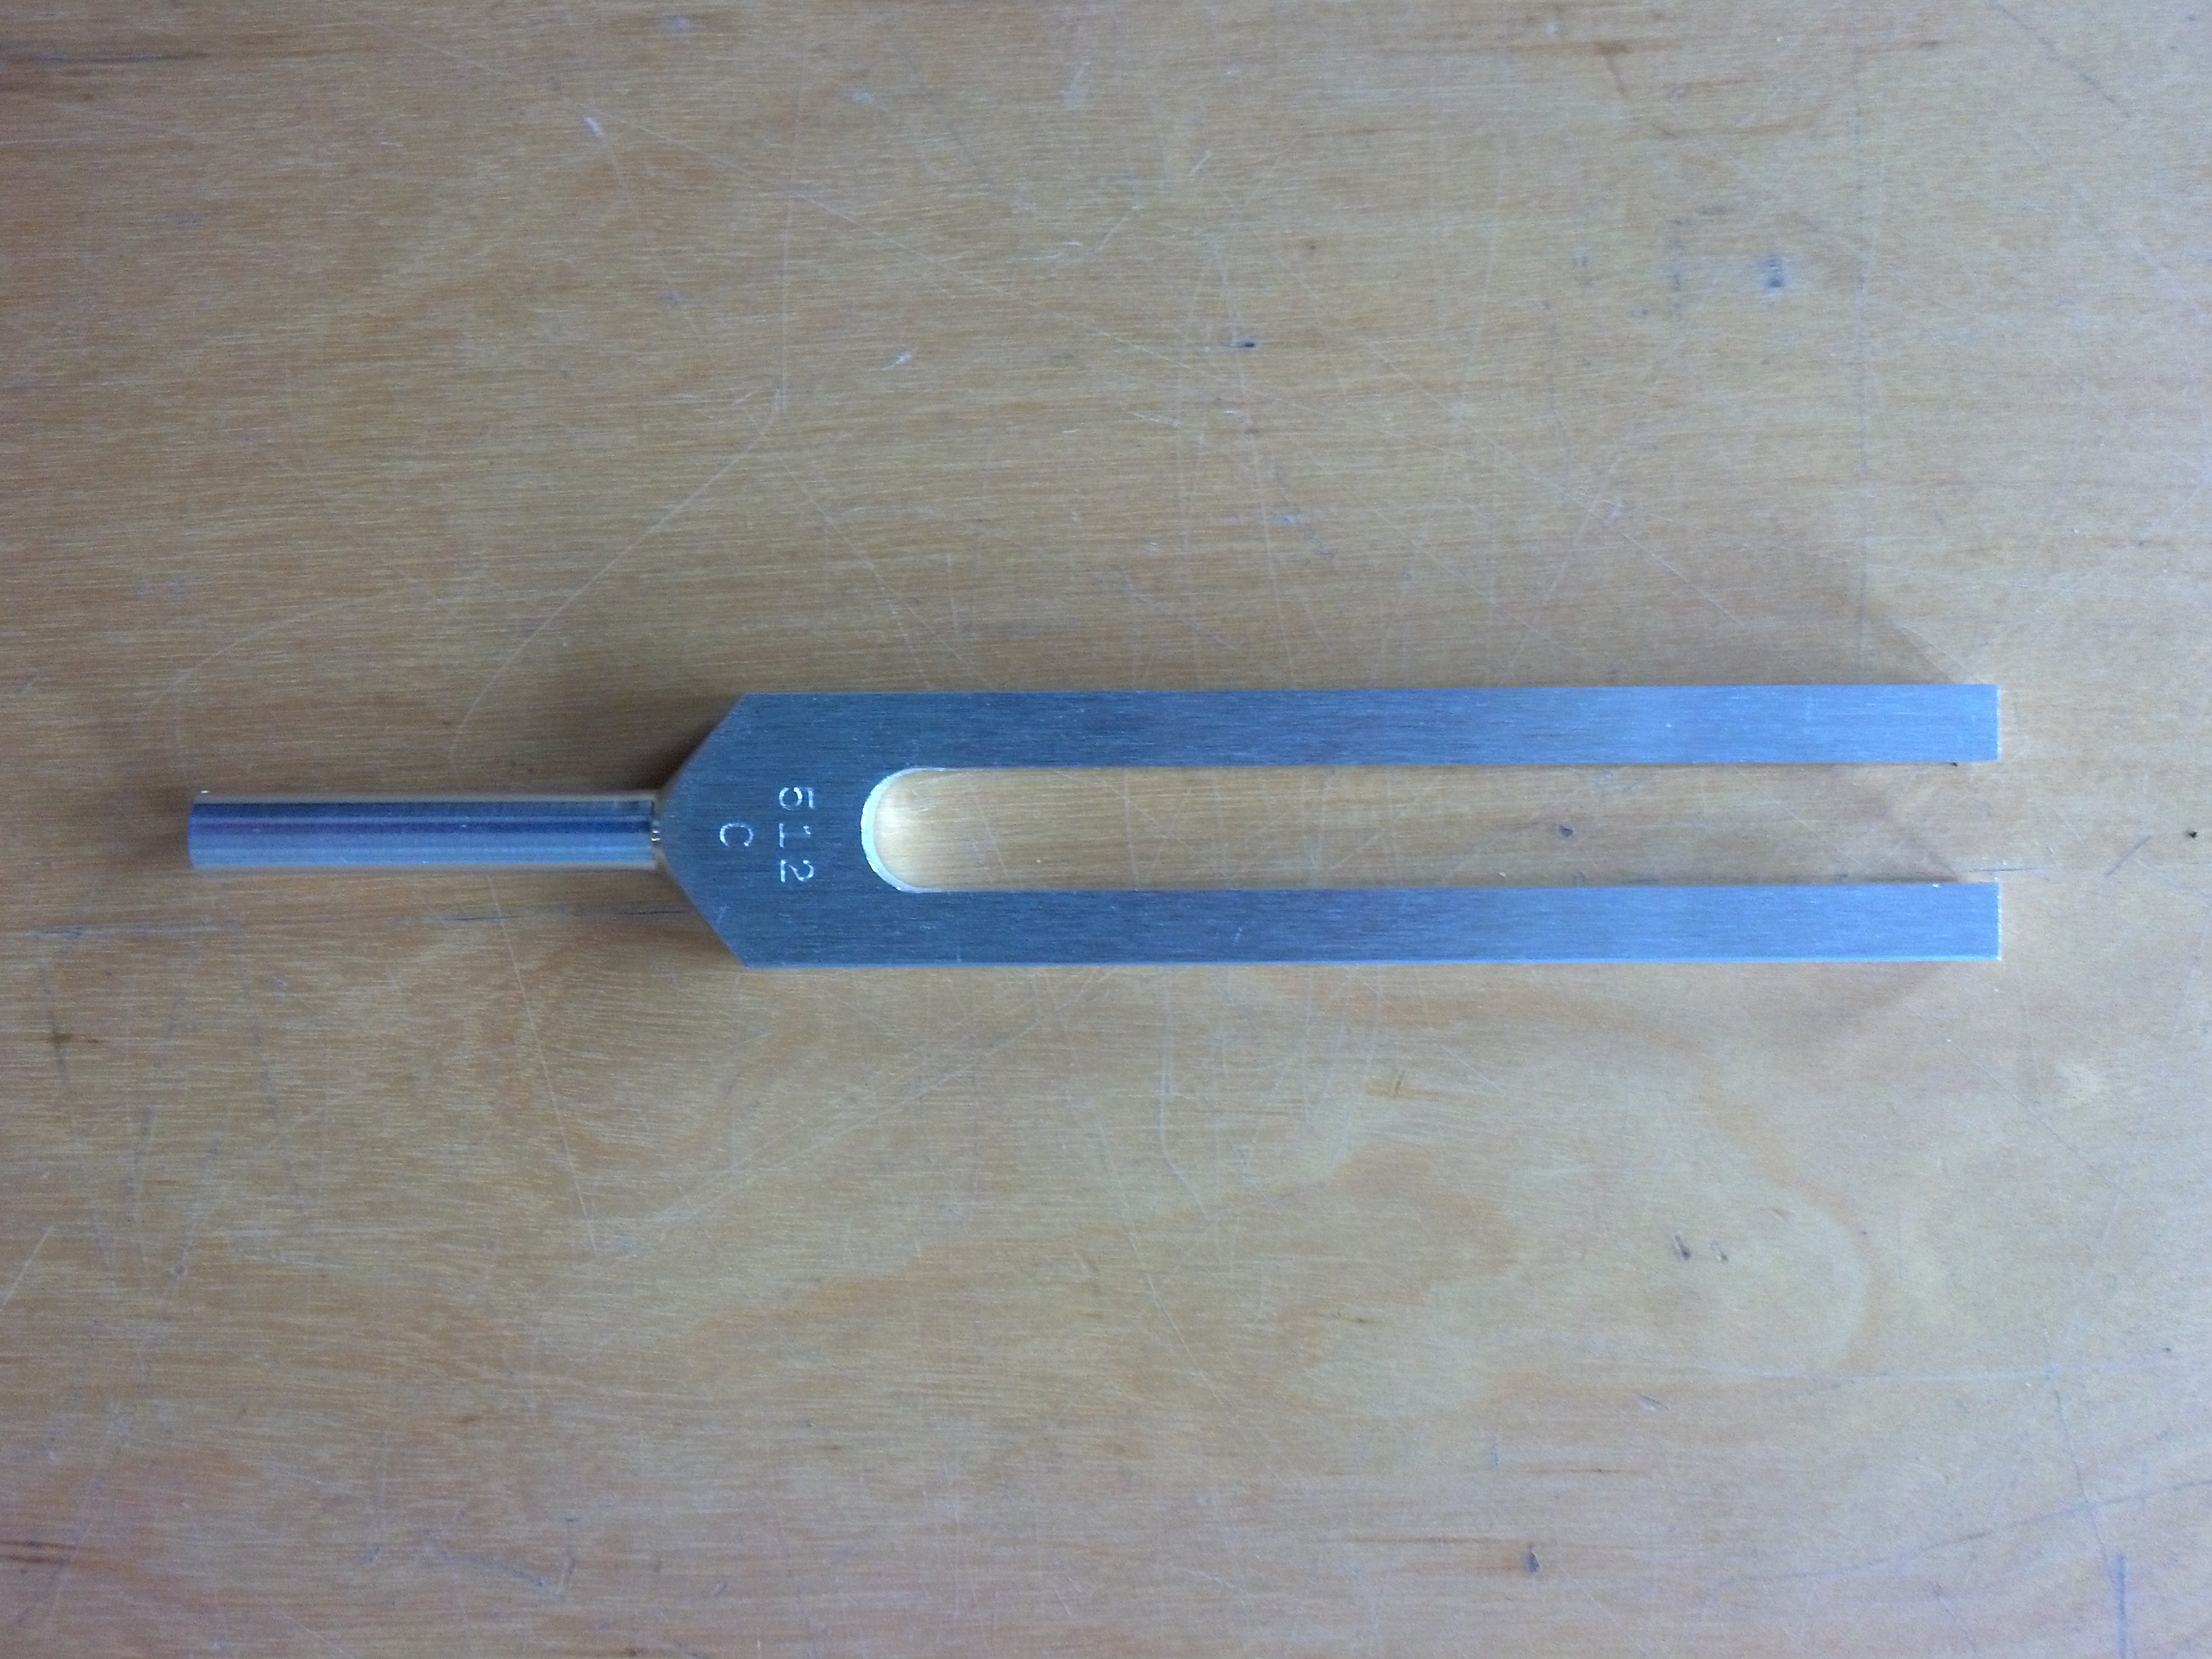
- Hardware: Tuning Fork (Aluminum, amazon.com)
- Software: ElmerFem (FEA analysis)
- Software: Gmsh (meshing for FEA model)
- Software: FreeCAD (CAD modeling)
- Software: Libreoffice/Excel (spreadsheet, conversion of FEA eignevalues into frequencies)
- Software: Audacity (audio analysis/recording, analyzes the frequencies in an audio file)
- Hardware: Microphone/headset microphone (allows you to record audio when you hit tuning fork in real life, I could also have used a cell phone)
- Hardware: Ruler + Vernier Calipers (to measure the tuning fork)
What Inputs Impact your Answer?
When you’re making a model of a part a number of inputs impact your answer. They are:
- Geometry – Is your CAD model accurate vs the real part?
- Element types – Did you use elements which will give you an accurate answer?
- Boundary Conditions – Is the way you’re holding the part in the model the same as the way you’re holding it in real life?
- Mesh density – Is the mesh fine enough to give you an accurate answer?
- Material Properties – Is your material correct?
Let’s examine some of the above inputs:
1) Geometry
I measured my tuning fork with some vernier calipers, accurate to 0 .1 mm, thicknesses in the forks of the prong only varied by +/- .02 mm, which is a +/- 0.28 % variation. My model used average measured dimensions. I assume my model is very close to the real life part.
2) Element Types:
Based on my previous work, I’m using 2nd order tetrahedral elements, which gave answers accurate to within 2% of predicted hand calculations in my previous post, Calculating the Vibration Frequency of a Cantilevered Beam.
3-5) Boundary Conditions, Mesh Density, ad Material Properties
I’ll examine these factors in depth below.
Boundary Conditions:
How you hold something changes which frequencies can be excited.
When pluck a guitar string you hear a certain not. When you press the sting onto the neck of the guitar you shorten the length of string that can vibrate. When you pluck the string again you hear a higher note. The note is mainly higher because its length is shorter. (It is also slightly higher because the tension has been increased a little bit).
The case we will analyze is called free-free, where the object is not rigidly held at all. A free-free part in real life would be floating in space not subject to a gravity. For us, dangling under gravity is close enough to approximate free-free analysis in Elmer.
In free-free condition, the part has many vibration modes and is not damped by being held or fixed at any location. I analyzed the tuning fork in the free-free conditions.
Real Life vs FEA Boundary Conditions
1) Free-Free
Real Life:
I hung the tuning fork by a thread and hit it with a knife and listened to the frequencies with my computer
FEA Model:
I analyzed the tuning fork without holding it anywhere. This is ‘free-free’ modal analysis. The first 6 modes must be ignored because they are rigid body motion, where the part is moving along an axis, or rotating. Modes higher than mode 6 will be seen in ‘real life’.
Mesh Density and Solve Time, Free-Free Model:
When you go from a coarse to a finer mesh, you answer converges on stable value.
But the finer you make your mesh, the more time it takes to get an answer. I solved for free-free tuning fork natural frequencies where I varied my mesh fineness from 1(coarse) to .2 (fine).
| Percent frequency error of each mode as is mesh made finer | ||||
| Mesh Fineness | 1 (coarse) | 0.7 | 0.4 | 0.2 (fine) |
| Mode Number | Freq. Error | Freq. Error | Freq. Error | Freq. Error |
| 1 (lowest frequency) | 0.56% | 0.21% | 0.19% | 0.00% |
| 2 | 0.46% | 0.35% | 0.12% | 0.00% |
| 3 | 0.77% | 0.46% | 0.21% | 0.00% |
| 4 | 1.07% | 0.75% | 0.31% | 0.00% |
| 5 | 0.82% | 0.30% | 0.23% | 0.00% |
| 6 | 2.20% | 1.18% | 0.50% | 0.00% |
| 7 | 1.43% | 0.84% | 0.38% | 0.00% |
| 8 | 0.89% | 0.66% | 0.33% | 0.00% |
| 9 (highest frequency) | 1.39% | 0.62% | 0.35% | 0.00% |
In this case, if I wanted an answer that was accurate to within 1% convergence for modes 1-9, I need a mesh density of .4 or finer. But when you make your mesh finer, it takes longer to get the answer.
| Fineness | Nodes | Tet. Elements | Time (mm:ss, real) | Convergence Accuracy |
| 1 (coarse) | 1762 | 905 | 01:02 | 2.20% |
| 0.7 | 2291 | 1207 | 01:23 | 1.18% |
| 0.4 | 3281 | 1728 | 02:05 | 0.50% |
| 0.2 (fine) | 10647 | 5816 | 09:52 | 0.00% |
If I had to get my answer in less than 3 minutes, I would chose a fineness of .4 to 1. But if I wanted a more accurate answer, I could choose a finer mes size, like .2, and wait around 10 minutes for the answer.
Material Properties
For my free-free mesh density tests I ran above, I was using the generic Elmer aluminum material. This material is listed as ‘Aluminum (generic)’. Is this the same aluminum that my part is made from?
Below are the material properties for Elmer’s ‘Aluminum (generic)’
Note: Elmer material library is in an xml file, which was at ‘C:\Elmer7\bin\edf\egmaterials.xml’ on my computer
<material name =”Aluminium (generic)” >
<parameter name=”Density” >2700.0</parameter>
<parameter name=”Youngs modulus” >70.0e9</parameter>
<parameter name=”Poisson ratio” >0.35</parameter>
<parameter name=”Shear modulus” >26.0e9</parameter>
<parameter name=”Bulk modulus” >76.0e9</parameter>
<parameter name=”Heat expansion coeff.” >23.1e-6</parameter>
<parameter name=”Heat conductivity” >237.0</parameter>
<parameter name=”Heat capacity” >897.0</parameter>
<parameter name=”Electric resistivity” >26.50e-9</parameter>
<parameter name=”Electric conductivity” >37.73e6</parameter>
<parameter name=”Sound speed” >5000.0</parameter>
</material>
Because we’re working on a linear elastic model, the only material properties we need are Density, Young’s modulus, and Poison Ratio. So is the aluminum above the same as the aluminum my tuning fork is made out of? Looking at Wikipedia, the aluminum in Elmer is pure elemental aluminum. If I bought aluminum, the cheapest form would be an aluminum alloy of some type, so our Elmer material is probably not accurate.
The product page for my tuning fork, here, lists the material as being aluminum and says the fork is “Produced from 3/8 inch x 1 inch bar for superior performance and consistent frequency accuracy”. If I were to machine the tuning fork, I’d want to make it out of a machinable and cheap aluminum. Looking at Mcmaster-Carr, the cheapest aluminum in that form is Alloy 6061. I’ll assume that the manufacturer wanted to minimize material costs, and chose this alloy.
| Material | Pure Aluminum | Aluminum 6061 |
| Density (kg/m^3) | 2700 | 2712.63 |
| Youngs Mod (Gpa) | 70 | 68.9 |
| Poisson Ratio | 0.35 | 0.33 |
Let’s do a sanity check. What if the website is wrong and our tuning fork is steel? A magnet doesn’t stick to it, so it’s not steel. The tuning fork’s weight on my kitchen scale is 55 grams, and the volume of my part in FreeCAD is 1.98616E-05 m^3. Density = mass/volume = 2769 kg/m^3. This density is within 3% of pure aluminum, so it’s an aluminum alloy. Let’s rerun my analysis with 6061 and compare the results to real life!
* Aluminum 6061 properties: http://asm.matweb.com/search/SpecificMaterial.asp?bassnum=MA6061t6
| Material | Pure Aluminum | Aluminum 6061* |
| Density (kg/m^3) | 2700 | 2712.63 |
| Young’s Modulus (Gpa) | 70 | 68.9 |
| Poisson Ratio | 0.35 | 0.33 |
And our free-free results using a mesh fineness of 0.4 are:
| Mode | Frequency (real, hz) | FEA, Pure Al. | FEA, 6061 Al. | % Error, Pure Al. | % Error, 6061 |
| 1 | 514 | 535 | 529 | 4.1% | 3.0% |
| 2 | 874 | 908 | 900 | 3.9% | 2.9% |
| 3 | 1,499 | 1,567 | 1,550 | 4.5% | 3.4% |
| 4 | 1,939 | 2,015 | 1,994 | 3.9% | 2.8% |
| 5 | 3,148 | 3,272 | 3,238 | 3.9% | 2.9% |
| 6 | 3,592 | 3,711 | 3,671 | 3.3% | 2.2% |
| 7 | 4,055 | 4,223 | 4,179 | 4.2% | 3.1% |
| 8 | 4,439 | 4,576 | 4,536 | 3.1% | 2.2% |
| 9 | 5,233 | 5,464 | 5,407 | 4.4% | 3.3% |
So our error using 6061 Aluminum is 3% or less when compared to real life frequencies. Not bad!
Real Life Free-Free Frequencies, How-To Measure Them
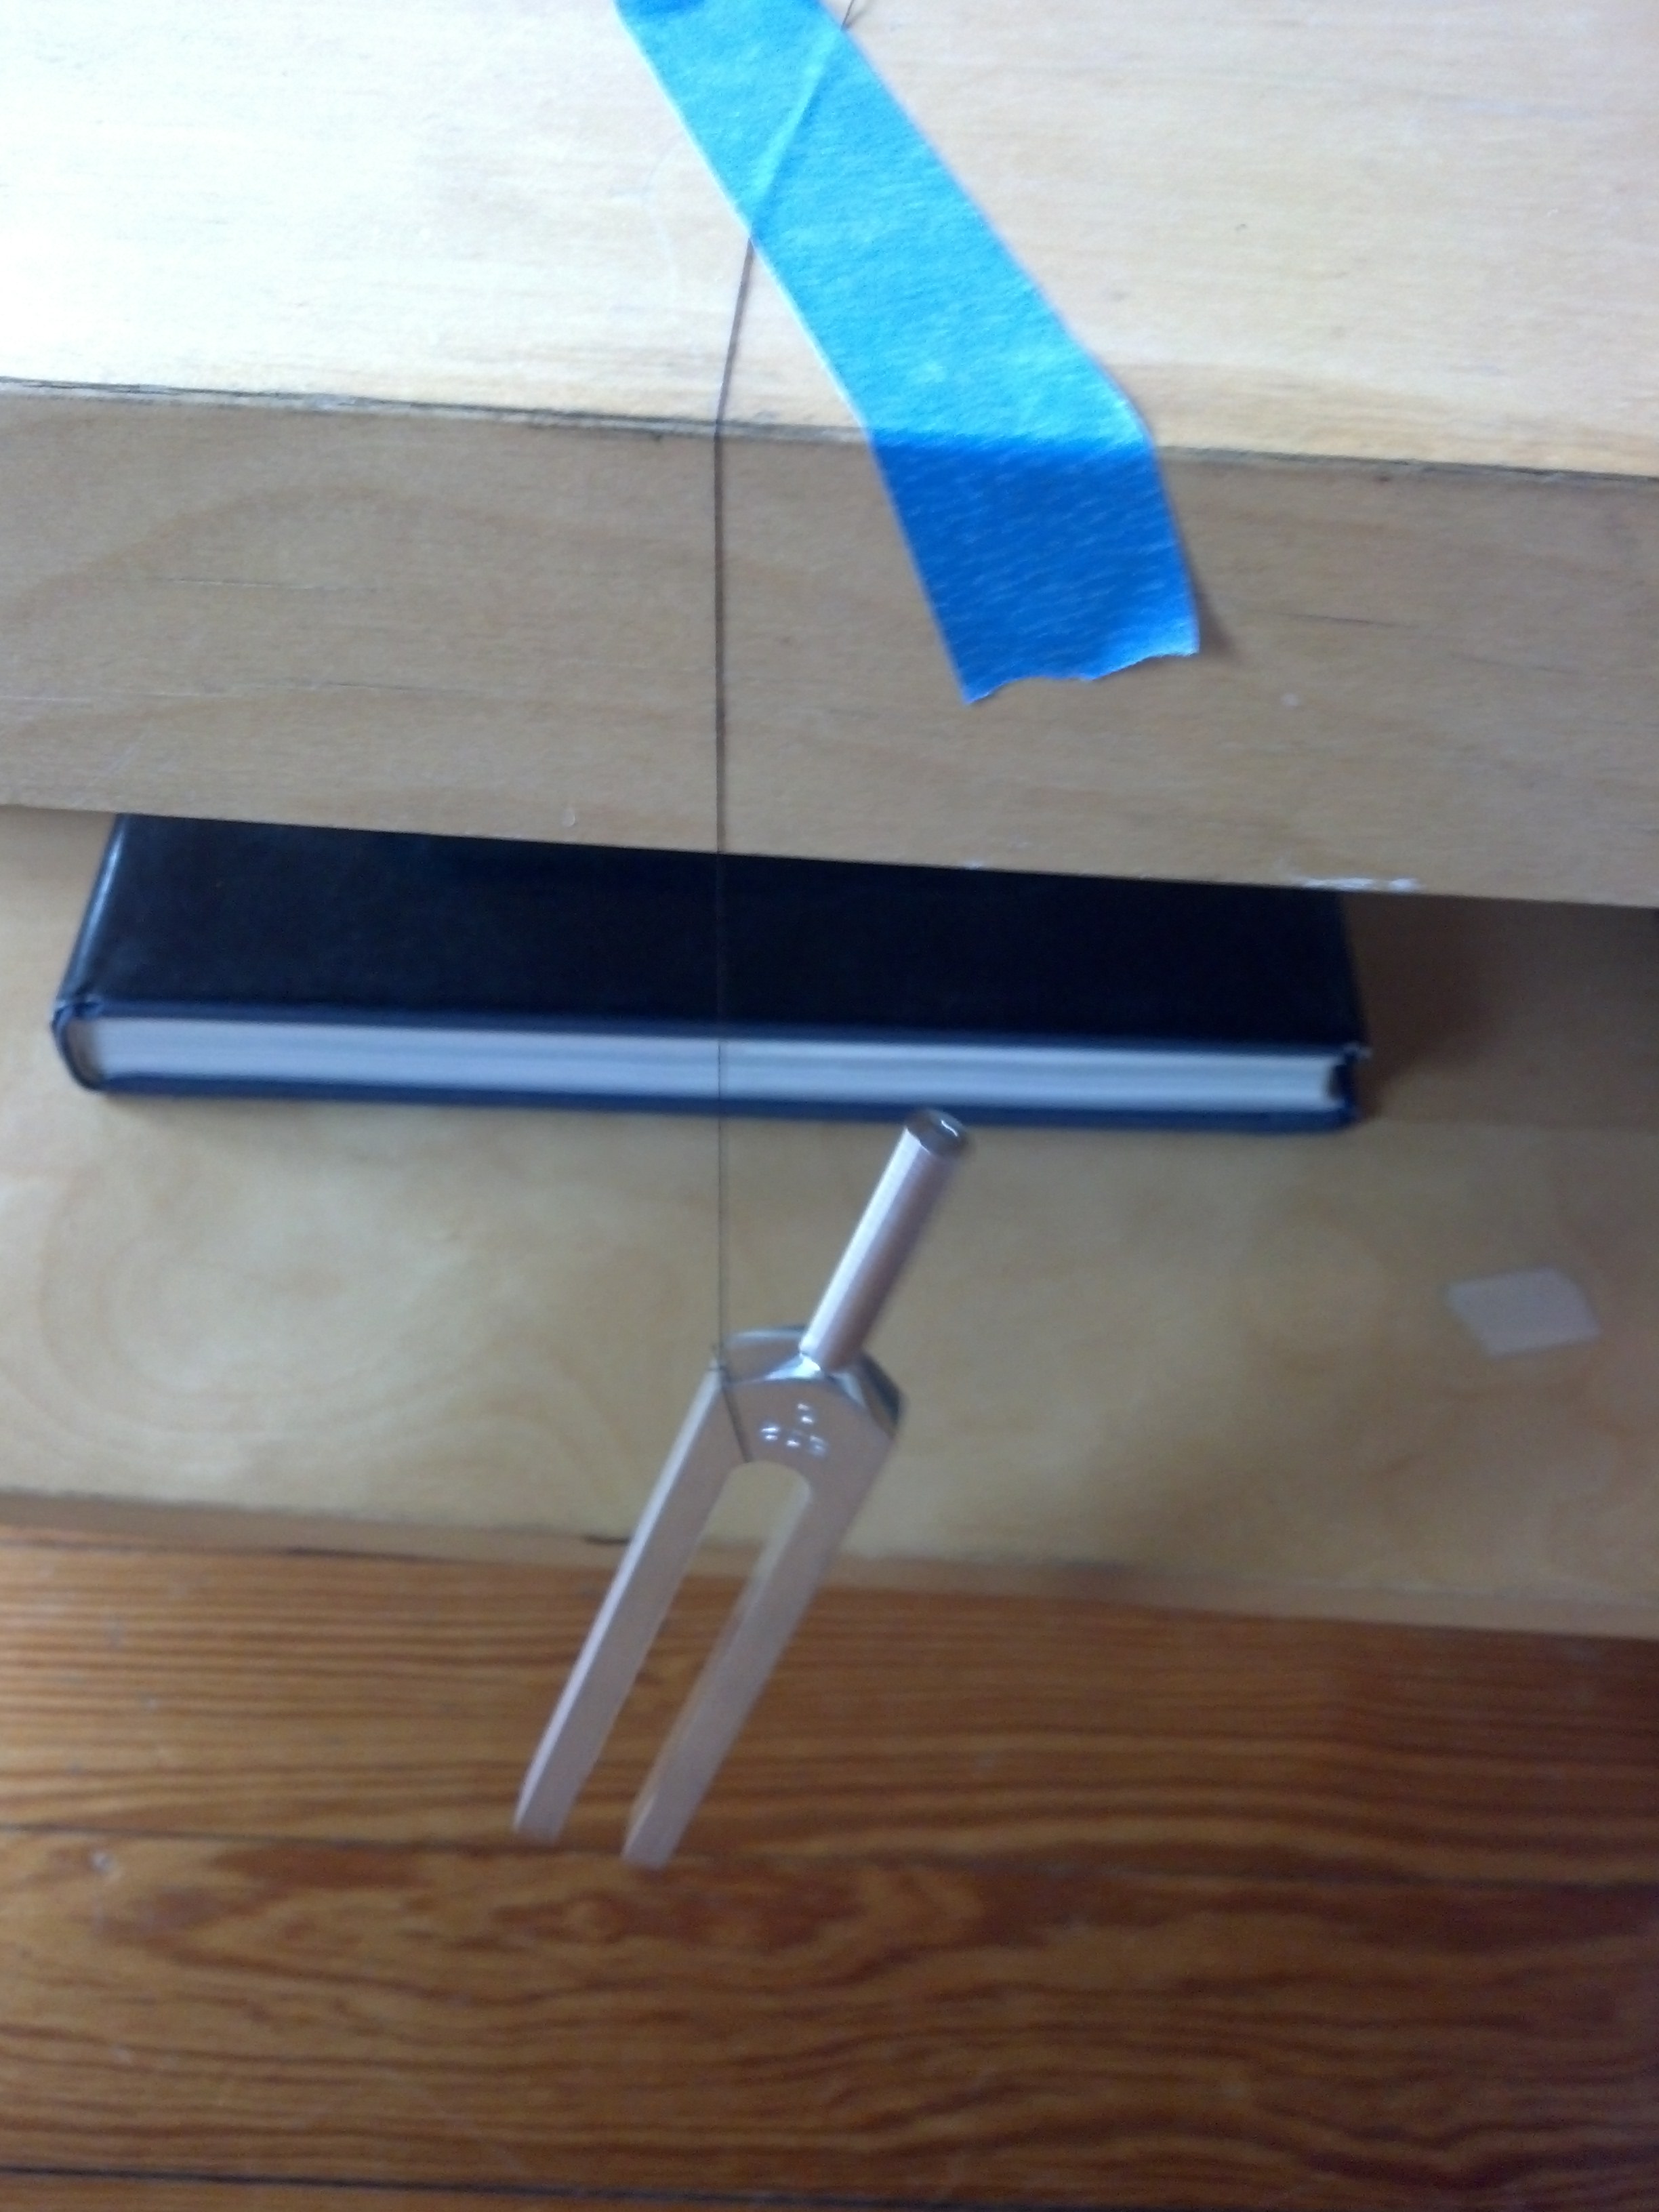
Measuring the part frequencies in real life is quite easy. I hung my tuning fork from a table using some thread. Then I pinged the fork with a knife and recorded the audio in Audacity. My micrphone was the integral microphone in my headset. You need to cut the audio sample down to a small sample, excluding the clang when you hit the fork. Then you select, Analyze, Plot Spectrum*. Below is a plot of the spectrum analysis:
*Note that because I recorded at 44.1 khz sampling rate, and my sample size is 4096, so my resolution is only 10 hz buckets, resolution = sample rate / size.
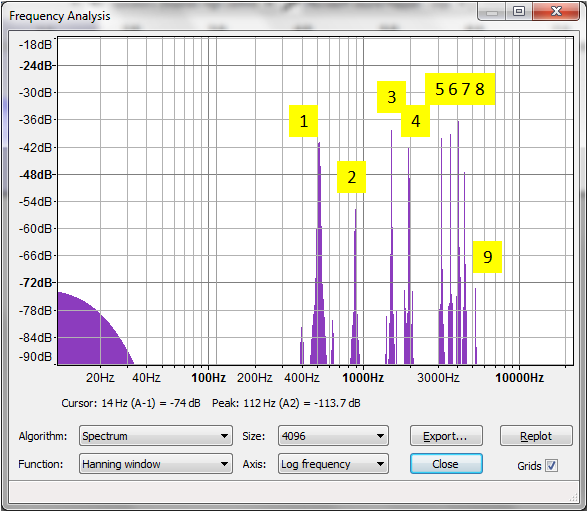
| Mode | Frequency (hz) |
| 1 | 514 (this is the loudest one, the “tuning fork” frequency) |
| 2 | 874 |
| 3 | 1499 |
| 4 | 1940 |
| 5 | 3148 |
| 6 | 3592 |
| 7 | 4055 |
| 8 | 4439 |
| 9 | 5234 |
So we saw agreement of 3% to free-free frequencies!
Hand Calculation Check:
Using the fixed-free cantilevered beam natural frequency equation, the calculation for the first mode, the lowest frequency, appears below.
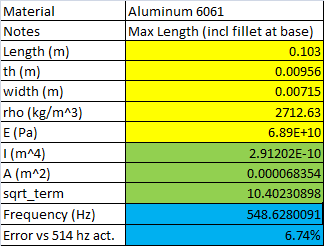
As shown above, the hand calculation is accurate within 7% of real life. This is a little worse than the 3% we were able to achieve with Elmer.
Note: This post was inspired by the following page: https://sites.google.com/site/lucidanalysis/examples/tuningfork
All files needed to run this analysis can be downloaded here


Dear Justin, I’ve been looking for a good test case for simulating sound radiation from a structure. Our company, Kuava, is developing fast boundary element solvers for acoustics. See,
http://www.kuava.fi/software-solutions/waveller-audio-and-noise-simulation-system/
In our simulation services we have used Elmer and collaborated with CSC (we are also based in Finland), the organization that develops Elmer. Your tuning fork model would a great example for our purposes since you have nicely coupled simulations with simple experiments. We would like run acoustic simulations to see how different modes radiate sound (radiation pattern, efficiency etc). I.e. we would use your Elmer results (surface velocities) as input to the BE simulation. Would it possible get your Elmer input files for the model? Of course, we’ll refer to your work when showing the results (if we get the simulations running smoothly…). Best regards, Tomi Huttunen
Tom, That’s fine. My files are posted. Feel free to use them. -Justin
Thank you for a very interesting article! Hopefully we’ll be able to repeat your calculations completely FreeCAD/CalculiX using FEM workbench soon. I’m doing some work in that area.
I’m having problems with your fork model – it comes in micrometers instead of milimeters. Do you know what version of FreeCAD you have used? I’m trying to diagnose where is the problem
Per my cad file date, I authored it in 2014-02-14. So that would have been Freecad version 0.13.